At 0134 UTC on April 27, The Australian Space Weather Forecasting Centre of the Australian Bureau of Meteorology issued a geomagnetic disturbance warning, stating, “An equatorial coronal hole is currently elevating solar wind speeds. Combined with the anticipated impact from a recent CME on April 27, geomagnetic activity is expected to be at G0-G1 levels over April 27 – 28, with a slight chance of an isolated period of G2.”
Solar and geomagnetic indicators moved in opposite directions this week. Average daily sunspot numbers over April 20 – 26 made a dramatic drop from 146.9 to 91.4, and average daily solar flux dropped from 164.5 to 139.4.
Average daily planetary A index more than tripled from 8.1 to 26.9, while average middle latitude A index more than doubled from 7.3 to 15.6.
Solar wind and explosions caused all of this grief.
Spaceweather.com reported that on April 21, a large magnetic filament on the sun exploded and hurled debris toward Earth.
Later, they reported that on April 23, at 1737 UTC a CME hit Earth, which sparked a severe G4-class geomagnetic storm. Aurora was visible as far south as southern New Mexico and Texas.
The planetary K index went as high as 8 over April 23 – 24.
Predicted solar flux over the next month is 135 on April 27 – 30; 140 on May 1 – 6, then 145, 150, 155, 160, and 165 on May 7 – 11; 170 on May 12 – 13, then 165, 160, 155, 150, 145, and 140 on May 14 – 19; 135 on May 20 – 21; 130 and 125 on May 22 – 23; 120 on May 24 – 25, and 125, 130, and 135 on May 26 – 28.
Predicted planetary A index is 18, 25, and 12 on April 27 – 29; 8 on April 30 through May 3, then 10, 8, 12, and 10 on May 4 – 7; 8 on May 8 – 9, then 5, 5, and 12 on May 10 – 12; 5 on May 13 – 15; 8 on May 16 – 17; 5 on May 18 – 22, then 15 and 18 on May 23 – 34, and 15 on May 25 – 27.
Here is a link to the aurora as observed in China:
Here is a link to explaining the aurora:
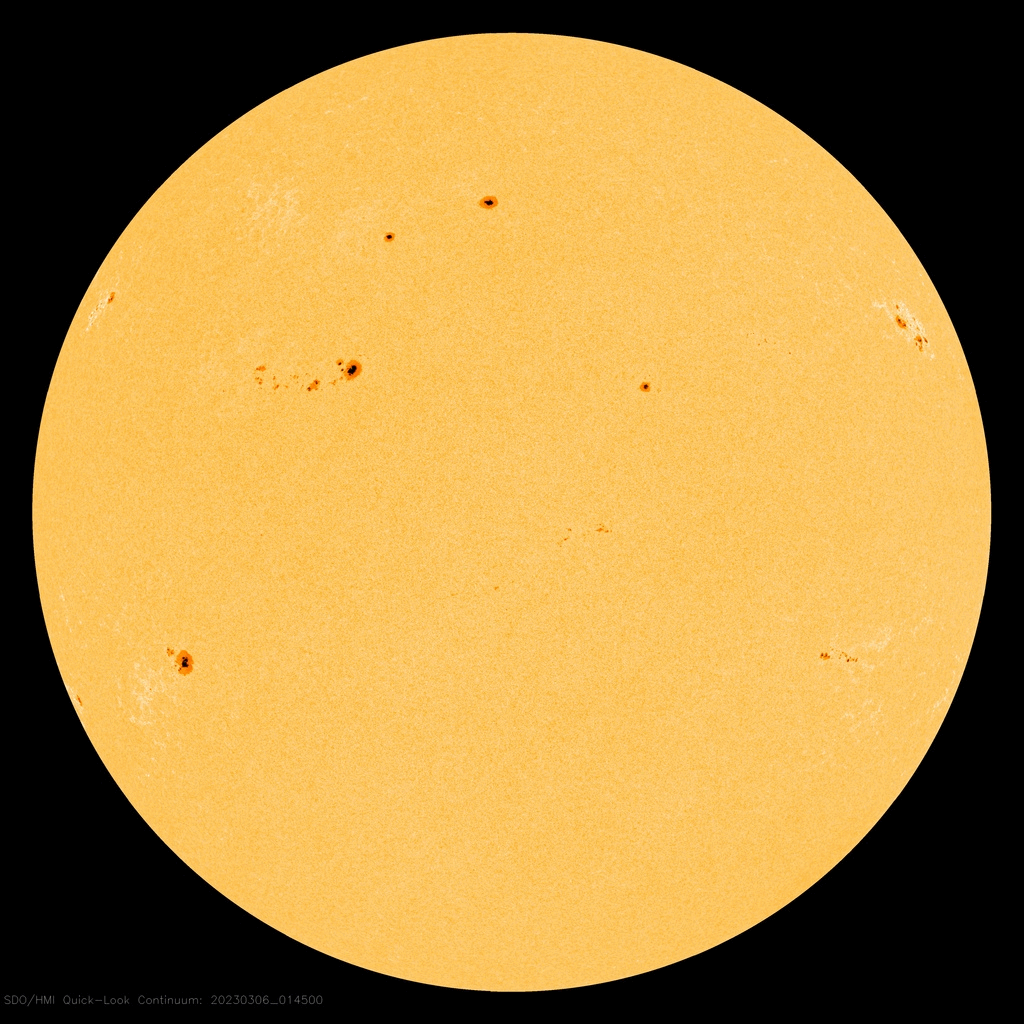
Sunspot numbers for April 20 through 26, 2023, were 97, 114, 87, 86, 88, 87, and 81, with a mean of 91.4. 10.7-centimeter flux was 147, 151.2, 141.2, 135.2, 133.9, 130.7, and 136.5, with a mean of 139.4. Estimated planetary A indices were 5, 9, 7, 66, 76, 10, and 15, with a mean of 26.9. Middle latitude A index was 5, 8, 6, 32, 39, 7, and 12, with a mean of 15.6.
For more information concerning radio propagation, visit the ARRL Technical Information Service, read “What the Numbers Mean…,” and check out the Propagation Page of Carl Luetzelschwab, K9LA.
A propagation bulletin archive is available. For customizable propagation charts, visit the VOACAP Online for Ham Radio website.
Share your reports and observations.