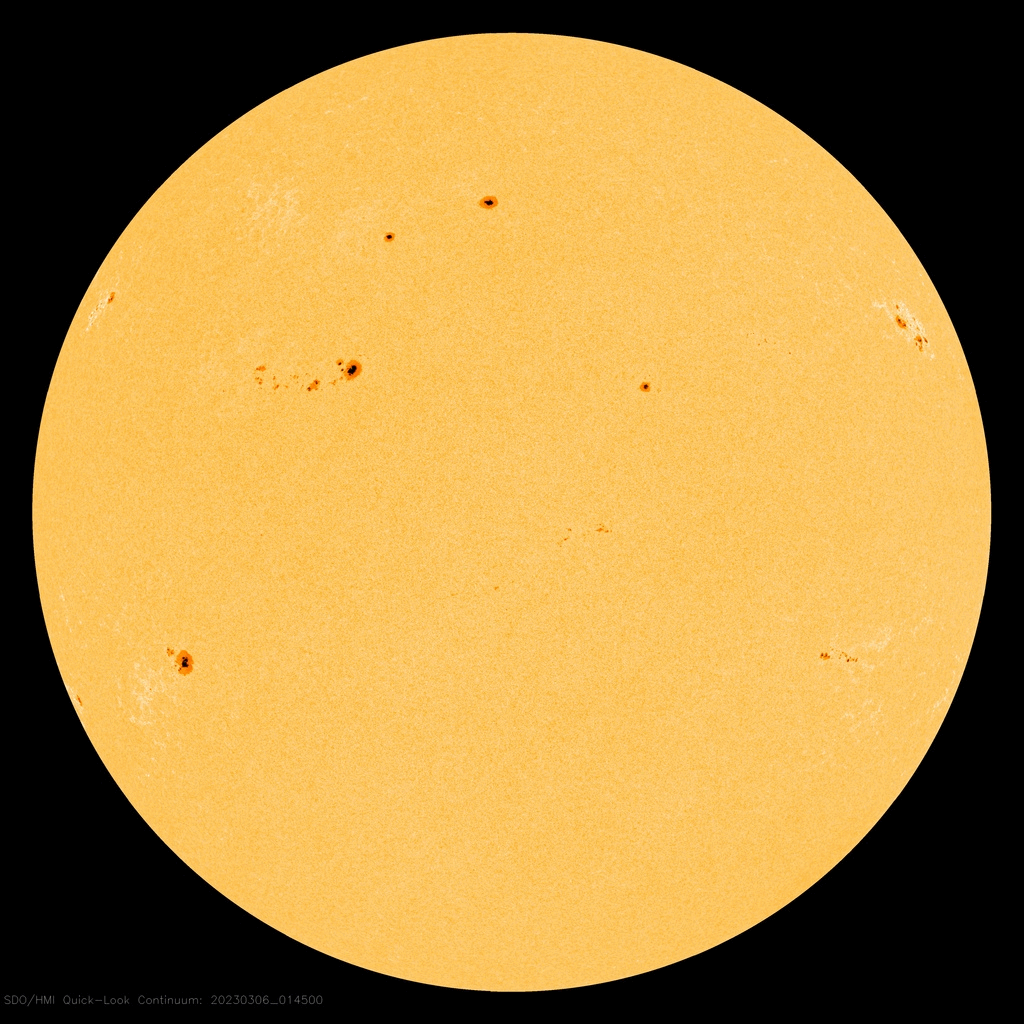
2/17/23 Solar Report

At 0725 UTC on February 15, 2023, the Australian Space Weather

Forecasting Centre issued a geomagnetic disturbance warning:

“A coronal mass ejection (CME) impact occurred around 2200 UTC on February 14. Magnetic field strength (Bz) has been southward for the majority of time since impact, and there is a chance of G1 geomagnetic conditions.”

Bz is the north-south direction of the interplanetary magnetic field (IMF).

They predicted a disturbance for February 15 – 16.

For the latest geomagnetic conditions, I prefer this source:

https://www.swpc.noaa.gov/products/planetary-k-index

More on the IMF:

https://bit.ly/3E6IZ15

Many sunspots appeared during this reporting week, February 9 – 15: three new sunspot groups on February 9, one more on February 10, two more on February 11, another on February 12, and three more on February 13.

Recent sunspot images:

https://www.spaceweather.com/images2023/12feb23/hmi1898.gif

This URL is for February 12. To see February 13, just change the “12feb23” string in the URL to “13feb23,” and so on, for any other dates.

Average daily sunspot numbers increased from 95.1 to 182.4, and average daily solar flux from 155.9 to 196.4.

Geomagnetic activity also rose, with average daily planetary A index going from 11.7 to 13.7, and middle latitude numbers from 7.6 to 10.7.

The most active days were at the beginning and end of the week, with planetary A index at 21 on February 9, and at 29 on February 15. On those two days, the college A index at Fairbanks, Alaska, was 33 and 46. The quietest day was Monday, February 13, when the planetary A index was 4.

The outlook for the next month looks a bit more modest, with predicted solar flux at 175 and 172 on February 16 – 17; 170 on February 18 – 19; 165 on February 20; 160 on February 21 – 23; 130 on February 24 – 26; 140 on February 27 to March 1; 145 on March 2 – 3; 150, 155, and 165 on March 4 – 6; 180 on March 7 – 13; 170 on March 14 – 15; 160 on March 16 – 18; and 150 on March 19.

Predicted planetary A index is 18, 22, 30, and 12 on February 16 – 19; 5 on February 20 – 21; 8 on February 22; 10 on February 23 – 24; then 5, 5, and 8 on February 25 – 27; 5, 5, and 8 again on February 28 through March 2; 5, 5, and 16 on March 3 – 5; 18, 15, and 8 on March 6 – 8; and 5 on March 9 – 20.

Sunspot numbers for February 9 through 15, were 150, 190, 209, 197, 185, 206, and 140, with a mean of 182.4. The 10.7-centimeter flux was 214.9, 207.8, 209.5, 199.7, 189.2, 179.7, and 173.7, with a mean of 196.4. Estimated planetary A indices were 21, 16, 11, 7, 4, 8, and 29, with a mean of 13.7. Middle latitude A index was 16, 12, 10, 5, 3, 6, and 23, with a mean of 10.7.

Propagation report 2/9/23

For this week’s ARRL Propagation Bulletin ARLP006:

A period of rising solar activity returned this week.

Ten new sunspot groups appeared this reporting week, February 2 – 8, 2023: two on February 3, one each on February 4 – 5, four more on February 6, and two more on February 8.

Early on February 9, Spaceweather.com reported a large emerging sunspot over the sun’s southeast horizon.

The average daily sunspot number for this week rose from 80.7 to 95.1, and the average daily solar flux from 139.5 to 155.9.

Geomagnetic indicators rose as well. The planetary A index rose from 7.9 to 11.7, and the middle latitude numbers rose from 5.9 to 7.6.

The rise in geomagnetic activity was related to solar wind late in the reporting week.

Predicted solar flux is 192 on February 9; 195 on February 10 – 13; 190 on February 14 – 15; 170 on February 16; 150 on February 17 – 18; 145, 140, 135, 130, and 135 on February 19 – 23; 130 on February 24 – 26; 125 on February 27; 130 on February 28 – March 3; 135, 150, and 160 on March 4 – 6; 155 on March 7 – 8; 160 on March 9, and 155 on March 10 – 12.

Predicted planetary A index is 12 on February 9 – 10; 5, 5, and 8 on February 11 – 13; 5 on February 14 – 17; 8 on February 18 – 19; 5 on February 20 – 21; 10 on February 22 – 24; 5, 5, and 8 on February 25 – 27; 5, 5, and 8 on February 28 – March 2; 5, 5, and 10 on March 3 – 5; 15, 15, 12, and 8 on March 6 – 9, and 5 on March 10 – 16.

Tamitha Skov’s latest, from February 5:

Sunspot numbers for February 2 through 8 were 56, 74, 66, 79, 139, 110, and 142, with a mean of 95.1. The 10.7-centimeter flux was 134.9, 134.5, 139, 144, 156.7, 184.7, and 197.6, with a mean of 155.9. Estimated planetary A indices were 6, 9, 6, 5, 18, 20, and 18, with a mean of 11.7. Middle latitude A index was 2, 6, 5, 3, 13, 12, and 12, with a mean of 7.6.

1/27/23 Solar Report

Tad Cook, K7RA, of Seattle, Washington, reports for this week’s ARRL Propagation Bulletin, ARLP004:

From the first week of 2023, we saw a dramatic and welcome increase in solar activity, but it softened in this reporting week, January 19 – 25.

Average daily sunspot numbers for the weeks starting with the final reporting week for 2022 were 96.1, 97, 135.9, 173.4, and 162.

Over the same period, average daily solar flux was 143.8, 157.8, 181.2, 221.8, and 198.9.

The northern hemisphere winter solstice was more than a month ago, and through the next two months we will see a gradual transition toward spring conditions.

Predicted solar flux over the next month shows values peaking near 205 on February 14 – 15. Predicted numbers are 170 and 165 on January 26 – 27; 160 on January 28 – 31; 165, 170, 180, and 185 on February 1 – 4; 190 on February 5 – 6; 195 on February 7 – 12; 200 on February 13; 205 on February 14 – 15; 200 on February 16 – 18; 195, 200, and 190 on February 19 – 21; 185 on February 22 – 23; 180 on February 24 – 25, and 175 on February 26 – 28. Flux values may peak above 200 again after March 10.

Predicted planetary A index, an indicator of geomagnetic instability, is 10 on January 26; 8 on January 27 – 29; 5 on January 30 through February 1; 8 on February 2; 5 on February 3 – 6; 12 on February 7 – 8; 15, 12, and 5 on February 9 – 11; 8 on February 12 – 13; 5 on February 14 – 17; 8, 10, 10, 12, and 10 on February 18 – 22; 8 on February 23 – 25, and 5 on February 26 – 27.

More dramatic solar warnings.

https://bit.ly/3XGqNm

Sunspot numbers for January 19 – 25, 2023, were 166, 197, 194, 166, 144, 127, and 140, with a mean of 162. The 10.7-centimeter flux was 226.1, 217.5, 208.7, 198.6, 189.1, 180.2, and 171.8, with a mean of 198.9. Estimated planetary A indices were 7, 6, 17, 9, 7, 4, and 7, with a mean of 8.1. Middle latitude A index was 6, 4, 11, 7, 5, 3, and 5, with a mean of 5.9.

Send your tips, questions, or comments to k7ra@arrl.net.

A comprehensive K7RA Solar Update is posted Fridays on the ARRL website. For more information concerning radio propagation, visit the ARRL Technical Information Service, read “What the Numbers Mean…” and check out the Propagation Page of Carl Luetzelschwab, K9LA.

A propagation bulletin archive is available. For customizable propagation charts, visit the VOACAP Online for Ham Radio website.

Share your reports and observations.

Tad Cook Report 1/19/23

Tad Cook, K7RA, of Seattle, Washington, reports for this week’s ARRL Propagation Bulletin:

Last week’s bulletin opened with “Wow!” I don’t know what to say about this week, except it is beyond “wow!”

This actually has me thinking about Cycle 19.

Average daily sunspot numbers rose from 135.9 to 173.4, while average solar flux went to 221.8 from 181.2.

From Spaceweather.com: “If sunspot production continues apace for the rest of January, the monthly sunspot number will reach a 20-year high.”

Average planetary A index increased from 6.7 to 13.9.

On January 15, 2023, planetary A index reached a peak of 30, a very high value indicating a geomagnetic storm. Conditions were stormy throughout the week due to flares and coronal mass ejections. On that day in Fairbanks, Alaska, the college A index was 53. There was a large polar cap absorption event.

Nine new sunspot groups appeared during this reporting week, January 12 – 18. One on January 12, four on January 13, two more on January 15, and two more, one each, on January 17 – 18.

Predicted solar flux is 220, 218, 215, 212, and 210 on January 19 – 23; 206 on January 24 – 25; 200 and 190 on January 26 – 27; 185 on January 28 – 29; 190 on January 30 through February 2; 195 and 200 on February 3 – 4; 205 on February 5 – 6; 210 on February 7 – 11, then a big jump to 235 and 230 on February 12 – 13; 225 on February 14 – 16; 220 on February 17, and 215 on February 18 – 19.

Predicted planetary A index is 16, 12, 16, 12 and 8 on January 19 -23; 5 on January 24 – 25; 8, 12, and 8 on January 26 – 28; 5 on January 29 – 31; 12 and 8 on February 1 – 2; 5 on February 3 – 6; 12, 12, 15, and 12 on February 7 – 10; 5 on February 11 – 13, then 8, 15, 10, and 7 on February 14 – 17.

Sunspots in the news:

https://bit.ly/3Hdilp4

In Friday’s bulletin, look for a report from KA3JAW about his recent experiences on 10 -meter FM.

Sunspot numbers January 12 – 18, 2023, were 151, 181, 170, 177, 186, 185, and 164, with a mean of 173.4. The 10.7-centimeter flux was 211.6, 208.5, 227.8, 234.3, 228.1, 221.7, and 220.3, with a mean of 221.8. Estimated planetary A indices were 9, 12, 11, 30, 14, 6, and 15, with a mean of 13.9. Middle latitude A index was 8, 10, 9, 17, 10, 5, and 11, with a mean of 10.

Send your tips, questions, or comments to k7ra@arrl.net.

A comprehensive K7RA Solar Update is posted Fridays on the ARRL website. For more information concerning radio propagation, visit the ARRL Technical Information Service, read “What the Numbers Mean…” and check out the Propagation Page of Carl Luetzelschwab, K9LA.

A propagation bulletin archive is available. For customizable propagation charts, visit the VOACAP Online for Ham Radio website.

Share your reports and observations.

2023 Mike & Key Swap meet