ARRL update
May 23, 2024 by
Updated 5/22/2024
We are continuing to address a serious incident involving access to our network and systems. Several services, such as Logbook of The World® and the ARRL Learning Center, are affected.
We have heard from many LoTW® users, asking about the status of the service and its data. This is not an LoTW server issue, and LoTW data is secure.
Our editorial and production team is preparing the July issue of QST magazine, which is still going to press. It may be delivered a few days late to members who receive print subscriptions. The digitial edition should be published on time.
We appreciate your continued patience as our staff and others work tirelessly to restore affected systems.
This story will be updated with new developments.
MFJ Ceasing On-Site Production
May 2, 2024 by
MFJ Enterprises, Inc. founder Martin F. Jue, K5FLU, announced that as of May 17, 2024, the company will cease on-site production at their Starkville, Mississippi, facility. Ameritron, Hy-Gain, Cushcraft, Mirage, and Vectronics brand products will be affected by the shutdown.
In a letter posted to social media, Jue said he is looking forward to retiring:
Times have changed since I started this business 52 years ago. Our product line grew and grew and prospered. Covid changed everything [for] businesses, including ours. It was the hardest hit that we have ever had, and we never fully recovered.
I turned 80 this year. I had never really considered retirement, but life is so short, and my time with my family is so precious.
Jue founded MFJ Enterprises in 1972, after building a CW filter kit that sold for less than $10. Since 1990, the company has acquired several other legacy brands within the amateur radio market. Jue shared that the company will remain open to sell existing inventory because they have “a lot of stock on hand.” They will also continue to offer repair services for the foreseeable future.
Jue expressed gratitude to the many longtime employees of MFJ, some of whom have been with the company for 40 years.
He also thanked MFJ dealers and radio amateurs for their patronage over the decades.
He also sent a special message to ARRL Members and loyal QST readers:
“I give my deepest heartfelt thank you to my fellow hams all over the world, and especially to ARRL members and QST readers. In my youth, I was given a second-hand set of 1958 QSTs. I read them over and over until I practically memorized every word. This gave seed to MFJ.
MFJ became a worldwide ham radio leader only because of you. As I turned 80, I cannot thank you all enough for 52 wonderful ham radio years. Thank you, 73s . . . Martin F. Jue, k5flu”
The end is near.
April 14, 2024 by
Om May 5, 2024 we will have our last Sunday might informational net for the season. We plan to be back on the air late fall. We hope you have enjoyed the nets and we hope you will return when we get back from our summer vacation. Keep listening to the repeater and check the web site regularly as we will from time to time will have announcements that will concern the amateurs in our area of repeater coverage. Looking forward to hearing you all check in next fall.
FCC to Require Two Factor Authentication for CORES Users
March 29, 2024 by
The Federal Communications Commission (FCC) has announced an upcoming change to the Commission Registration System (CORES) that licensees use to pay any application or regulatory fees, manage or reset a password on an existing FRN, or request a new FRN. Beginning March 29, 2024, multifactor authentication will be implemented. Users will be prompted to request a six-digit secondary verification code, which will be sent to the email address(es) associated with each username. The user will then need to enter the code into CORES before they can continue.
In a public notice, the FCC said this change will make the system more secure. “This additional layer of security will further safeguard against unauthorized access, thereby enhancing the overall integrity of information contained within the CORES system and improving the security of user data,” it read.
The FCC recommends that users confirm they have access to their username account email and to add a secondary email address, if need be.
Resources are available for those who need assistance with the system. For inquiries or assistance regarding the implementation of multifactor authentication on CORES, submit a help request at https://www.fcc.gov/wtbhelp, or call the FCC at 877-480-3201 (Monday through Friday, 8 AM to 6 PM ET).
One of our own
March 29, 2024 by
On April 1, 2024, the ARRL Western Washington Section will have a new
Section Manager. I am pleased to introduce to the section’s
membership, Robert (Bob) M. Purdom, AD7LJ. WWA Section Manager Jim Pace, K7CEX appointed Bob to serve as an Assistant Section Manager on April 15, 2009. The best way to describe him is, he is a ham’s ham. Bob is a
veteran of the United States Air Force and United States Navy. He is a
retired naval officer and telecommunications engineer for the State of
Washington, where he did communications planning, worked on LMR mobiles and base stations, as well as Lahar, Earthquake and Tsunami
alert/warning systems. Bob has been a ham radio operator for 19 years.
He is a life member and very active in the Radio Club of Tacoma and a
member of the Capital Peak Repeater Group. Please join me in welcoming Bob, AD7LJ, as the new Section Manager for the Western Washington
Section.
I will become an Assistant Section Manager and working with Bob in
several project areas including membership recruiting, EMCOMM
intra/inter section cooperation, working with the section’s tribal
liaison to develop and implement an EMCOMM support system for our tribal neighbors and other tasks assigned by the section manager.
Thank you for your confidence and trust in allowing me to be the WWA SM
for the past 11 years. I will continue to be a responsible ARRL leader
for the section.
ARRL Western Washington Section
Section Manager: Monte L Simpson, W7FF
w7ff@arrl.org
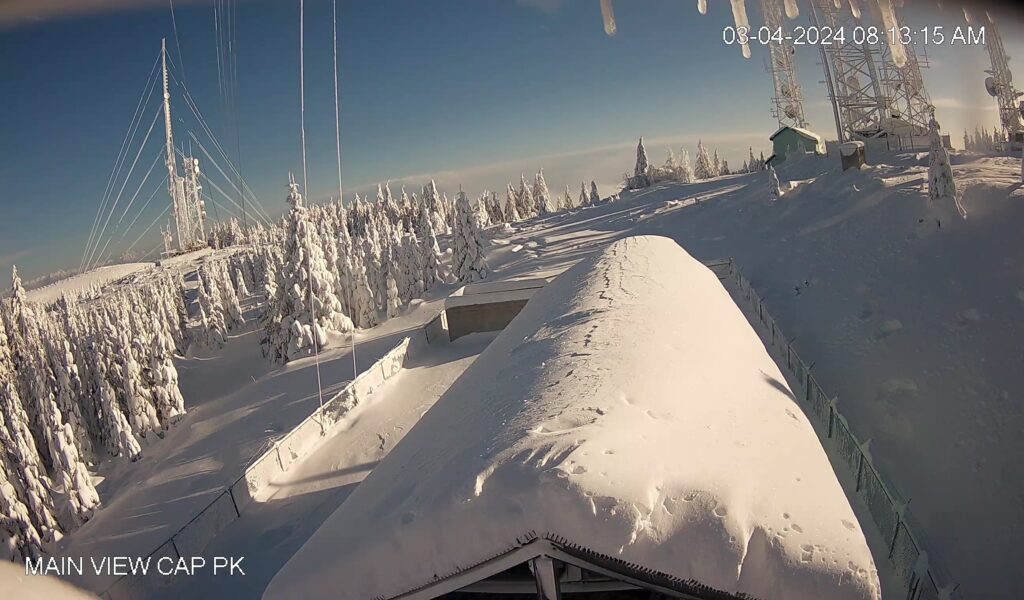
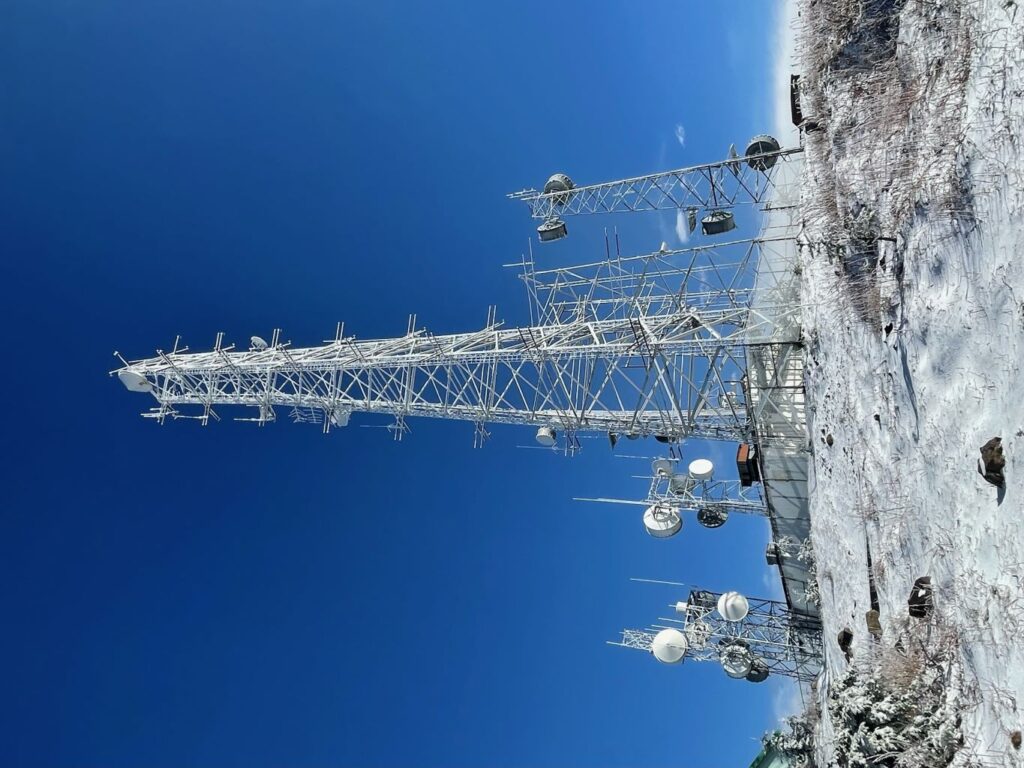
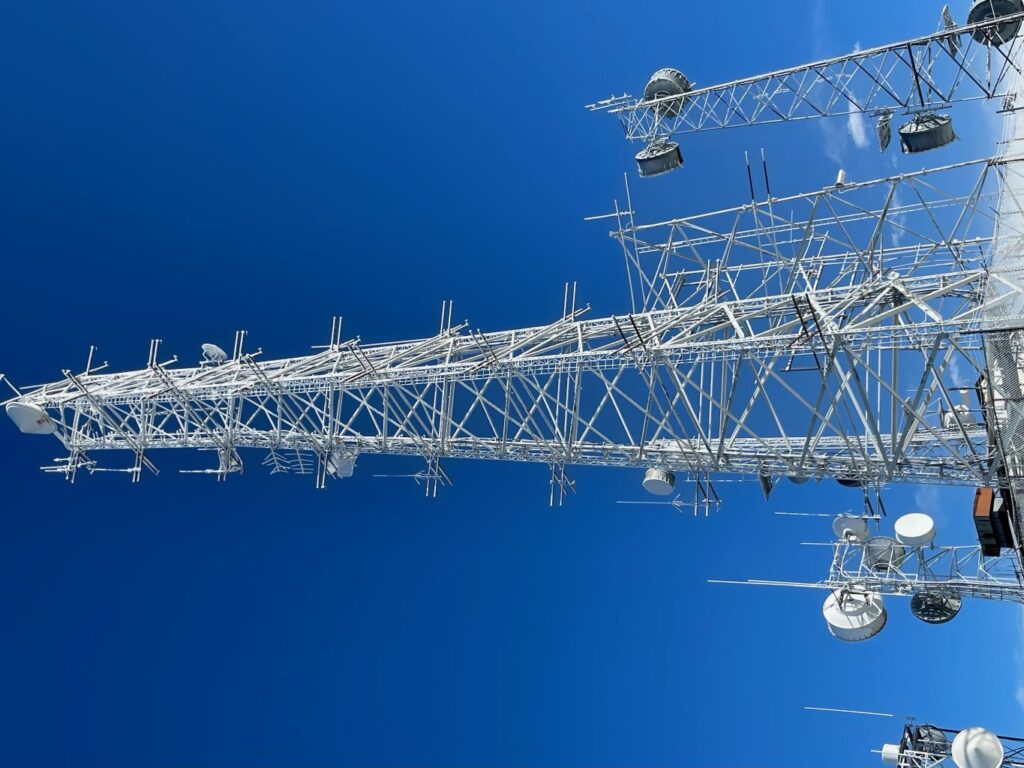
BRRR at the Peak.
February 27, 2024 by
Jeremy AG7WT shot these two pics showing the ice loading on the tower!
Once a month Breakfast
February 19, 2024 by
Although not an official function of the repeater group You are all invited to get with the group once a month (First Saturday of the month) at the Denny’s restaurant for breakfast, starting at 8:00 a.m. Located at the intersection of Martin Way and College St. in Lacey, WA. Click here for a map of the location.